Exemplos de visualização de informação que antecedem a explosão dos infográficos na Internet.
O exemplo de comunicação visual que o Gerson Mora trouxe há algumas semanas atrás, datado de 1946, assim como os posts que a Susana Pereira tem trazido também na sua coluna, são evidências da importância que o estudo da visualização de informação – jornalística, científica e outras – tem tido ao longo dos anos.
Realmente, a infografia está longe de ser uma novidade, e a visualização de informação faz parte da nossa história desde há muito tempo.
No Visual Loop Internacional é puiblicada, às segundas-feiras, uma compilação de infográficos, mapas, diagramas e outras formas de visualização ‘vintage’, e muitas delas chegam a ser quase tão antigas quanto o Brasil!
Aqui fica uma seleção dessas pérolas visuais, para termos como referência e inspiração:
Map of predominating sex (1872) | Francis Amasa Walker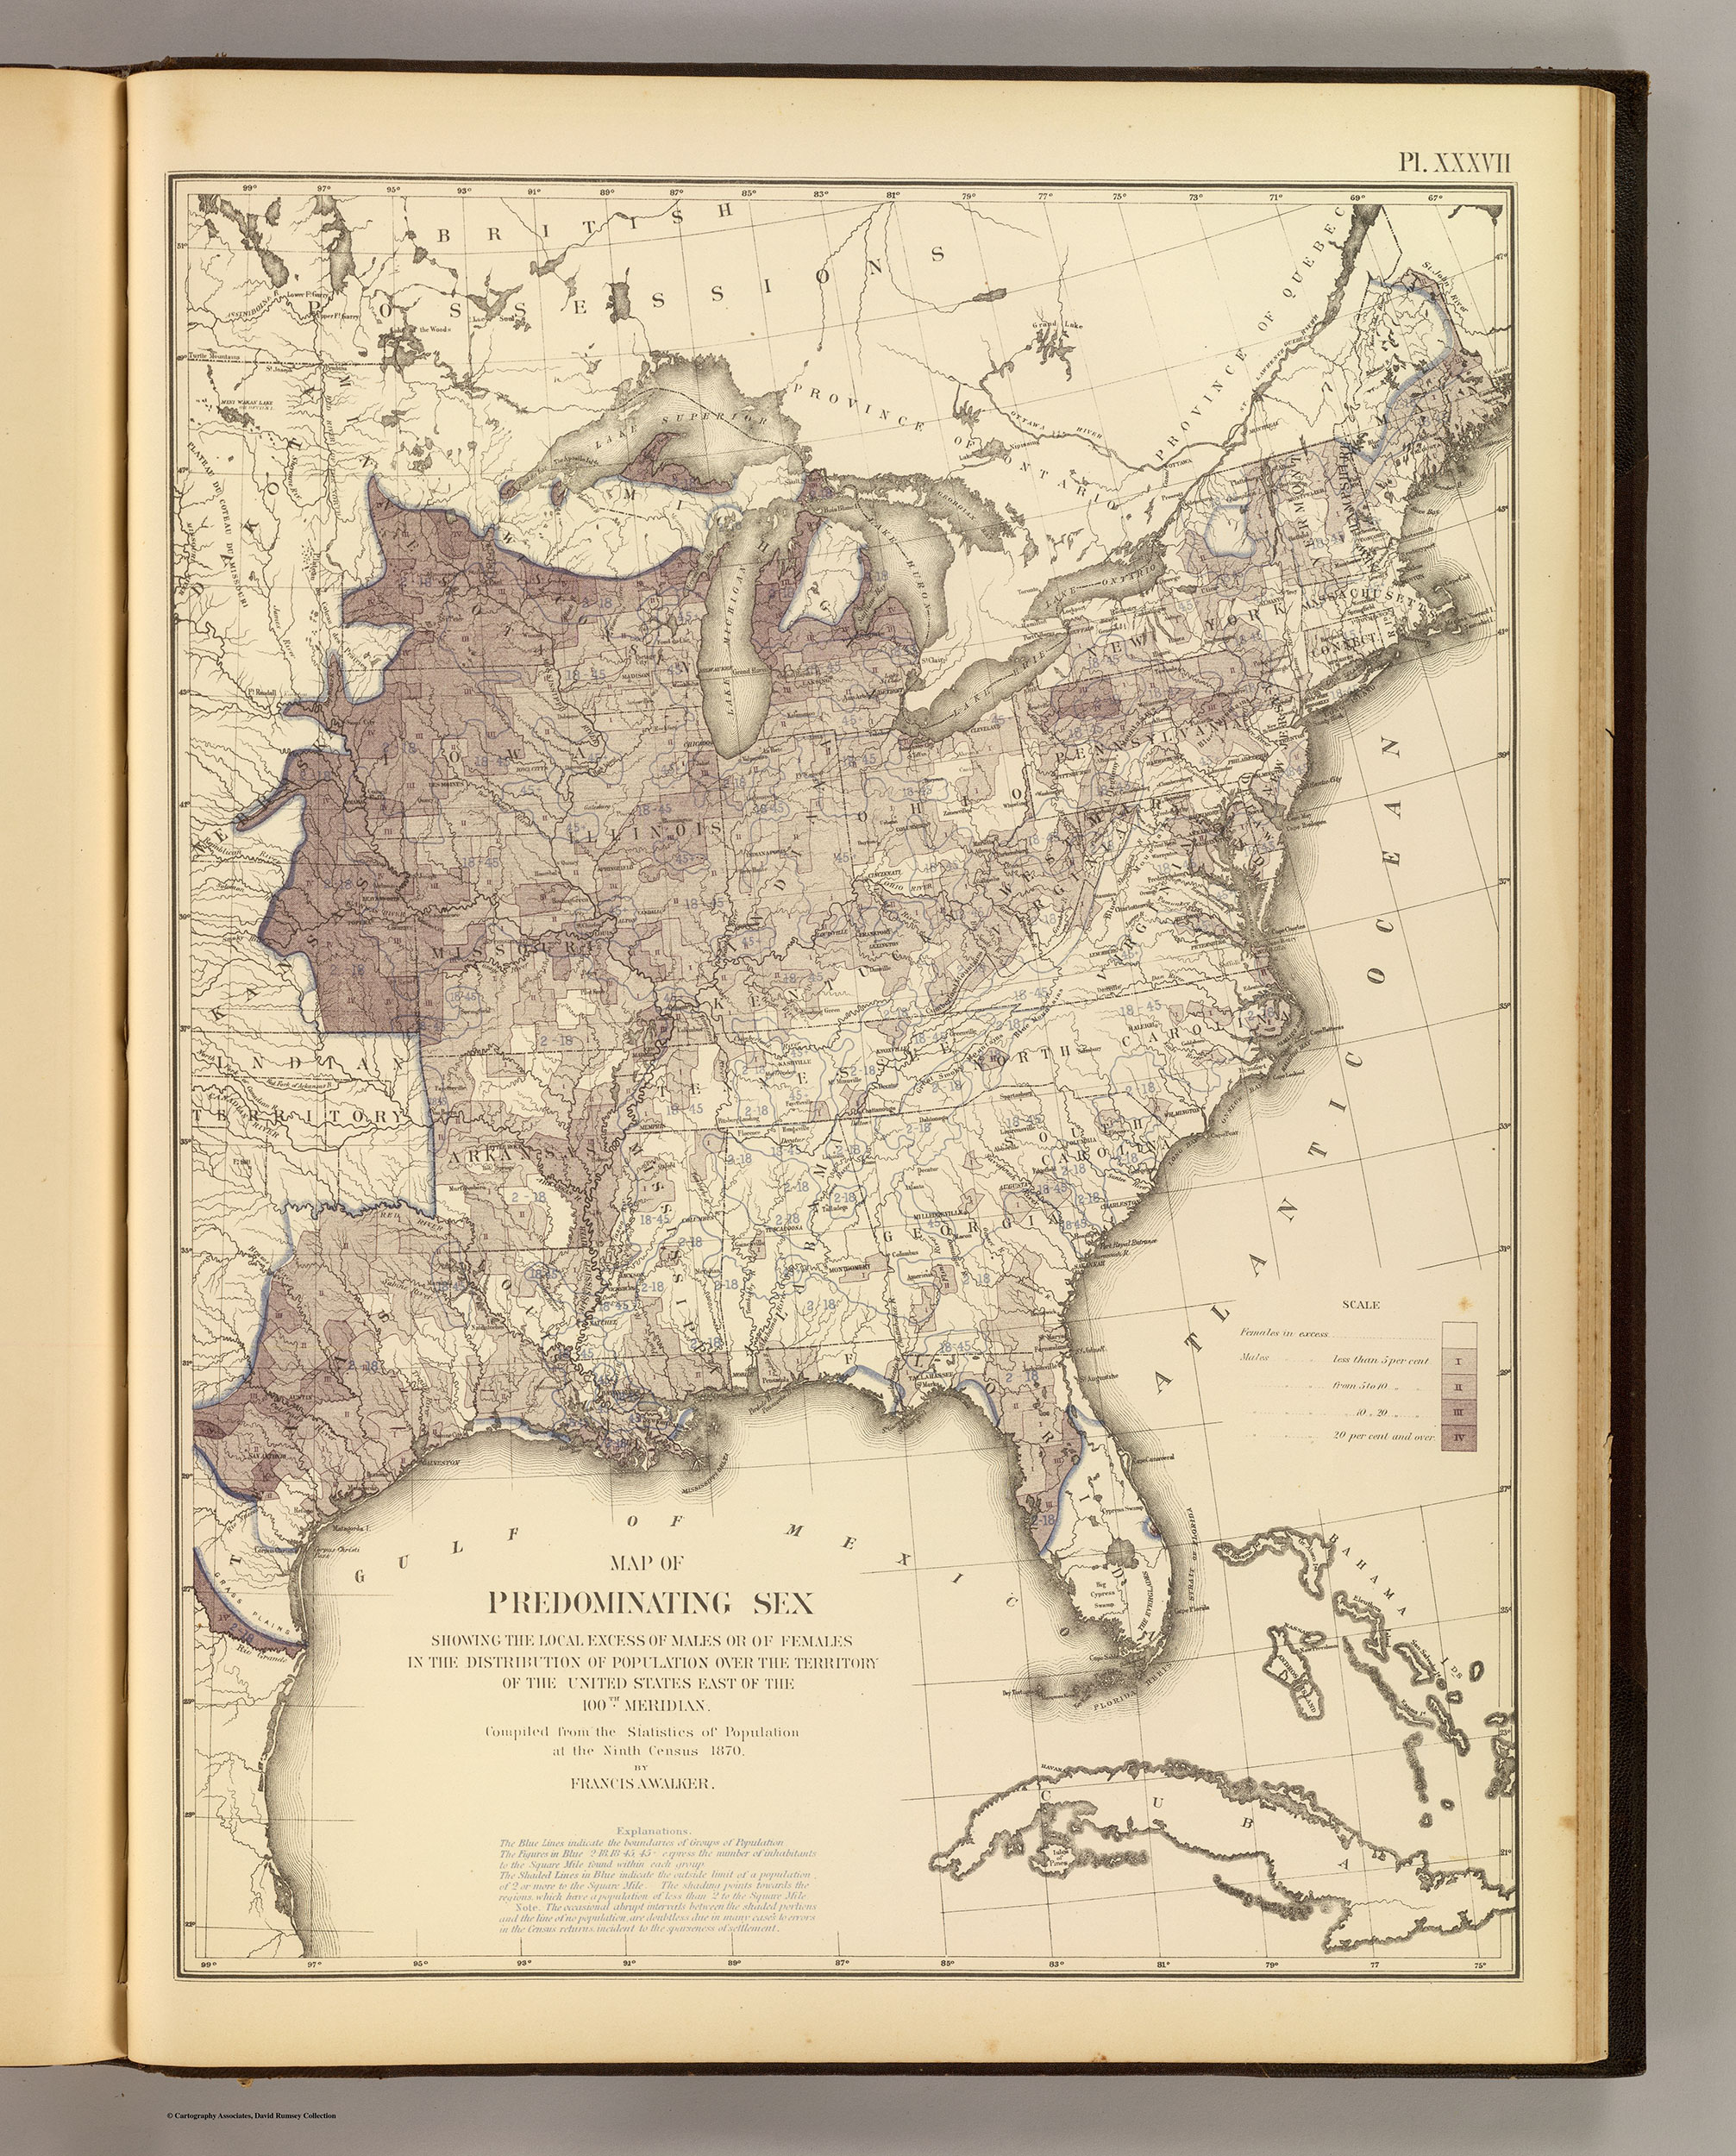
(image:Francis Amasa Walker ,1872)
(Via Mapping the Nation)
Aviation in Perspective (1917) | S. W. Clatworthy
(image:S. W. Clatworthy,1917 )
The Solar System (1913)
(image: Andrees Allgemeiner Handatlas)
(Via prof. Michael Stoll’s Flickr)
A Map of Physics (1939)
(A 1939 Map of Physics)
(Via Strange Maps)
China as the centre of the world (1602)
(Created created in 1602 by Italian Jesuit missionary Matteo Ricci)
(Via the Daily Mail)
Depthscrapers defy Earthquakes (1931)
Depthscrapers defy Earthquakes, published on Science and Mechanics magazine, 1935
(Via Modern Mechanix)
A Chronological Chart of the Visions of Daniel and John (1842)
Printed by Joshua Himes in 1842
(Via Visual Complexity)
Munster’s Map of the World (1544)
Originally published in Münster’s edition of Ptolemy’s Geographia and in Münster’s masterwork, Cosmographia in 1544.
(Via Florida History)
The World’s tallest buildings (1884)
Published by George F. Cram in Cram’s Unrivaled Family Atlas of the World, Chicago IL. Lithograph color print.
(Via Retronaut)
The wonders within your head (1938)
Look magazine, 1938
(Via Paul Carrington’s Flickr)
Inside the Earth (1863)
Earth cutaway (1863)
(Via El Biblionata on Flickr.)
How whiskey is distilled (1942)
Hiram Walker’s whiskey distillery, from Forbes magazine (1942)
Old Age Rejuvenator Centrifuge (1935)
(image: Science and Mechanics, 1935)
(Via Modern Mechanix)
Sarajevo before World War I (1905)
1905 Baedekers tourist’s map of the city of Serajevo
(Via First World War)
San Francisco Historical Creek Map (1890s)
San Francisco Historical Creek Map
(Via Oakland Museum of California)
Cellarius Harmonia Macrocosmica (1661)
(image: Andreas Cellarius, 1661)
(Via Wikimedia)
Occupation of Negroes and Whites in Georgia (1900)
(image: Prof. W.E.B. Du Bois and students, 1900)
(Via All my eyes)
Pendulum measuring (1718)
(image: Johann Leonhard Rost,1718)
(Via BibliOdissey)
Be on guard (1921)
(image: Dimitri Moor, 1921)
(Via Daily Mail)
United States and Great Britain in the World (1946) | P. Sargant Florence and Lella Secor Florence
(image:P. Sargant Florence and Lella Secor Florence,1946 )
(Via Brainpickings)
Rise of agricultural production, 1956-1960 (1982)
(image:Rise of agricultural production,1956-1960 )
(Via Ripetungi)
Mobile Pill-Box Fortress Mounts Two Six-Inch Guns (1940) | Popular Science
(image: Popular Science,1940)
(Via Modern Mechanix)
Magellanica (1616) | Petrus Bertius
(image:Petrus Bertius,1616 )
(Via Strange Maps)
The Moon’s Phases (c. 1840s) | Charles F Blunt
(image:Charles F Blunt,c. 1840s )
(Via BibliOdissey)
Space Patrol (1851) | Frank Tinsley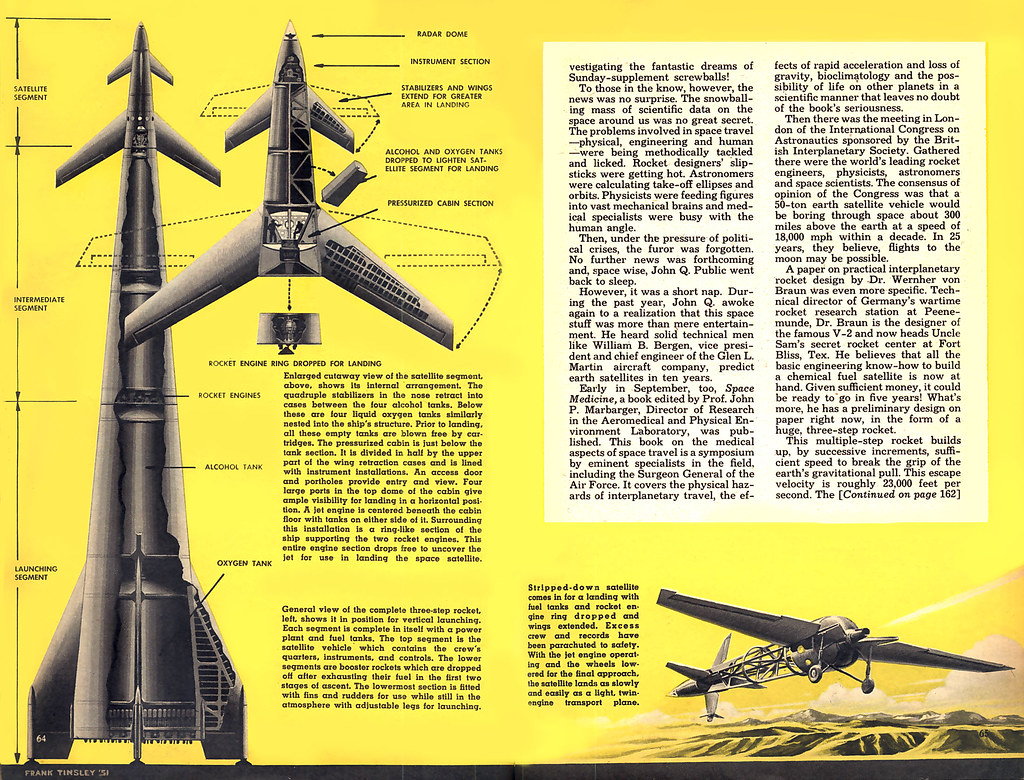
(image:Frank Tinsley, 1851 )
(Via James Vaughan on Flickr)
The House of Lords (1848) | The Guardian
(image:The Guardian, 1848)
(Via The Guardian Data Blog)
Wound Man (c. 1400s) | Claudius (Pseudo) Galen
(image:Wellcome Library,c. 1400s )
(Via Wellcome Library)
Pantograph (c. 1800s)
(image:The Canadian Centre for Architecture,c. 1800s )
(Via The Canadian Centre for Architecture)
Internal Ear (1908)
(image:Sue Clark’s,1908 )
(Via Sue Clark’s Flickr)
Magical Calendar (1582)
(image: peacay, 1582 )
(Via peacay on Flickr)
Statistical Atlas of the United States (1900)
(image:Prof. Michael Stoll,1900 )
(Via Prof. Michael Stoll on Flickr)
How to Know Your Guided Missiles (1950)
(image:Popular Science,1950 )
(Via Modern Mechanix)
Early Apollo Concept (1962) | Fortune Magazine
(image:James Vaughan,1962 )
(Via James Vaughan on Flickr)
Night-Club Map of Harlem (1932)
(image:Strange Maps,1932 )
(Via Strange Maps)
Geomancy Almanac (1552)
(image: BibliOdissey,1552 )
(Via BibliOdissey)
The book reader of the future (1935) | Everyday Science and Mechanics
(image:Paleofuture,1935 )
(Via Paleofuture)
Esta é apenas uma amostra da vastidão de exemplos de visualização de informação ao logo da história.
skip to main |
skip to sidebar


Marcadores
PESQUISAR NOS ARQUIVOS DO BLOG
Translate
Postagem em destaque
Links das postagens mais interessantes sobre a Força Expedicionária Brasileira.
Segue abaixo os titulos e os links correspondentes a algumas das postagens mais interessantes sobre a Força Expedicionária Brasileira e os P...
Clique nos títulos abaixo para ver as Postagens dos Heróis FEB com nome e imagem.
- Relembrar, Heróis da Força Expedicionária, Expedicionários, Ex combatentes
- Missão dada, missão cumprida. Força Expedicionária Brasileira - Pracinhas - Ex combatentes - soldados da FEB
- O que é ser um Herói? Força Expedicionária Brasileira - F.E.B - Alguns Expedicionários.
- Eles vieram de todas as partes do Brasil. Soldados do Brasil, Ex Combatentes, Libertadores, Expedicionários do Exercito Brasileiros, Pracinhas, mais algumas imagens.
- Expedicionários da Força Expedicionária fazendo tiro ao alvo na Itália - Segunda Guerra - Força Expedicionária Brasileira.
- Brasileiros da Força Expedicionária. F.E.B
- Força Expedicionária Brasileira - Expedicionários - Pracinhas - Soldados da F.E.B
- Força Expedicionária Brasileira (F.E.B) Eis aqui alguns expedicionários.
- Eu acredito - Imagens de 103 pracinhas da Força Expedicionária Brasileira. #pracinhas, #ex combatente, #feb, #força expedicionária, #brasil, #guerra na Itália.
ALGUNS DOS APLICATIVOS AQUI UTILIZADOS NÃO PERMITEM ACENTUAÇÃO GRÁFICA.
Número de visitas
SEGUIDORES
As opiniões expressas neste Blog, não representam necessariamente a opinião do administrador
.
ARQUIVOS DO BLOG
-
►
2024
(1)
- ► janeiro 2024 (1)
-
►
2021
(128)
- ► novembro 2021 (19)
- ► outubro 2021 (1)
- ► setembro 2021 (36)
- ► agosto 2021 (5)
- ► julho 2021 (27)
- ► junho 2021 (20)
- ► abril 2021 (7)
- ► março 2021 (1)
- ► fevereiro 2021 (4)
- ► janeiro 2021 (7)
-
►
2020
(475)
- ► dezembro 2020 (25)
- ► novembro 2020 (18)
- ► outubro 2020 (35)
- ► setembro 2020 (47)
- ► agosto 2020 (55)
- ► julho 2020 (158)
- ► junho 2020 (61)
-
►
2019
(238)
- ► setembro 2019 (17)
- ► agosto 2019 (102)
- ► março 2019 (62)
- ► fevereiro 2019 (57)
-
►
2017
(107)
- ► setembro 2017 (77)
- ► julho 2017 (13)
- ► junho 2017 (7)
- ► abril 2017 (3)
- ► março 2017 (7)
-
►
2016
(146)
- ► dezembro 2016 (20)
- ► novembro 2016 (1)
- ► outubro 2016 (1)
- ► setembro 2016 (20)
- ► agosto 2016 (6)
- ► julho 2016 (5)
- ► junho 2016 (5)
- ► abril 2016 (32)
- ► março 2016 (7)
- ► janeiro 2016 (7)
-
►
2015
(216)
- ► outubro 2015 (6)
- ► setembro 2015 (13)
- ► agosto 2015 (23)
- ► junho 2015 (8)
- ► março 2015 (59)
- ► fevereiro 2015 (76)
- ► janeiro 2015 (21)
-
►
2014
(223)
- ► agosto 2014 (35)
- ► junho 2014 (18)
- ► abril 2014 (25)
- ► março 2014 (38)
- ► fevereiro 2014 (42)
- ► janeiro 2014 (65)
-
▼
2013
(1246)
- ► dezembro 2013 (171)
- ► novembro 2013 (37)
- ► outubro 2013 (213)
- ► setembro 2013 (124)
- ► agosto 2013 (114)
- ► julho 2013 (93)
-
▼
junho 2013
(74)
- 1946: Fim da Liga das Nações
- 1907: Criação da Corte de Haia
- 1492: Colombo inicia a viagem do descobrimento
- Cristóvão Colombo, a América e a música
- 1946: Indonésia luta pela independência
- Como foi o impeachment de Collor?
- Quantas versões do Hino Nacional já existiram?
- Lamartine Babo o homem do tra-la-lá e dos hinos do...
- Quadrilha
- Império Mexicano
- A verdadeira história do Samba do Arnesto
- Circo Máximo de Roma
- Festas Juninas
- Se existe a Nova Zelândia, onde fica a "velha"?
- Já houve um dia 30 de fevereiro?
- Guerra do Vietnã
- EUA no Século XIX
- Colonização da América
- Populações indígenas do Brasil: experiências antes...
- Aprendizagem lúdica
- 1943: Patenteada a caneta esferográfica
- 1845: Patenteado o primeiro pneu
- 1817: Apresentada a precursora da bicicleta
- 1929: Nasce Anne Frank
- Soldados de Hitler
- O Brasil e seus nomes
- Mitologia Romana
- Origem da Mitologia
- Origem da Escrita
- África: Continente com ou sem “História”?
- Civilização Mesopotâmica
- Sumérios e acádios
- Tumor ósseo mais antigo atingiu neandertal há 120 ...
- A educação e a Catequese dos Jesuítas
- A GUERRA NO BRASIL
- Cientistas identificam restos de navio naufragado ...
- Imperador Tibério
- Imperador Cláudio
- Ordem dos Templários
- 6 de junho de 1944: O Dia D
- 5 de junho de 1967: A Guerra dos Seis Dias
- Encontrado na Itália manuscrito da Torá mais antig...
- Galileu Galilei
- Visão geral da história do gênero. - Fábulas
- Circo Máximo de Roma
- Festas Juninas
- A mais longa batalha da história
- 1740: Coroação de Frederico, o Grande
- 1945: Mulheres começam a reconstruir Berlim após a...
- 1953: Coroação da rainha Elizabeth 2ª
- 1989: Massacre na Praça da Paz Celestial
- Primeira e Segunda Guerra Latina
- Aclamação de Amador Bueno
- Castelos e sonhos
- 1947: É anunciado o Plano Marshall
- Guerra da Restauração
- Primeira e Segunda Guerra Servil
- Do Instantâneo ao Eterno
- Nova França
- Acordos de “paz” no pós-guerra
- O primeiro submarino
- O grande Leonardo: pinturas, desenhos, projetos
- Cronograma de um Símbolo
- Aula de história no cinema
- A evolução do logotipo da Volkswagen
- 35 infográficos e visualizações Vintage para inspi...
- Botica Real Militar
- Os 10 piratas mais temidos de todos os tempos
- Carlos Marighella – A bravura de antigos heróis br...
- Cientistas acham ossos de soldados da 1ª Guerra em...
- Meiembipe, a Ilha
- História da Guilhotina
- Rio Eufrates
- A Fundação Alexandre de Gusmão (FUNAG) coloca à di...
- ► abril 2013 (38)
- ► março 2013 (66)
- ► fevereiro 2013 (68)
- ► janeiro 2013 (109)
-
►
2012
(1680)
- ► dezembro 2012 (32)
- ► novembro 2012 (25)
- ► outubro 2012 (100)
- ► setembro 2012 (103)
- ► agosto 2012 (119)
- ► julho 2012 (172)
- ► junho 2012 (195)
- ► abril 2012 (140)
- ► março 2012 (284)
- ► fevereiro 2012 (130)
- ► janeiro 2012 (92)
-
►
2011
(1946)
- ► dezembro 2011 (95)
- ► novembro 2011 (66)
- ► outubro 2011 (163)
- ► setembro 2011 (158)
- ► agosto 2011 (119)
- ► julho 2011 (209)
- ► junho 2011 (122)
- ► abril 2011 (166)
- ► março 2011 (192)
- ► fevereiro 2011 (175)
- ► janeiro 2011 (212)
-
►
2010
(1331)
- ► dezembro 2010 (290)
- ► novembro 2010 (99)
- ► outubro 2010 (149)
- ► setembro 2010 (81)
- ► agosto 2010 (99)
- ► julho 2010 (125)
- ► junho 2010 (81)
- ► abril 2010 (124)
- ► março 2010 (86)
- ► fevereiro 2010 (36)
- ► janeiro 2010 (62)
-
►
2009
(983)
- ► dezembro 2009 (50)
- ► novembro 2009 (67)
- ► outubro 2009 (131)
- ► setembro 2009 (203)
- ► agosto 2009 (145)
- ► julho 2009 (77)
- ► junho 2009 (33)
- ► abril 2009 (63)
- ► março 2009 (72)
- ► fevereiro 2009 (62)
- ► janeiro 2009 (40)
-
►
2008
(257)
- ► dezembro 2008 (50)
- ► novembro 2008 (59)
- ► outubro 2008 (25)
- ► setembro 2008 (33)
- ► agosto 2008 (10)
- ► julho 2008 (21)
- ► junho 2008 (30)
- ► abril 2008 (8)
- ► março 2008 (3)
- ► fevereiro 2008 (1)
- ► janeiro 2008 (5)
-
►
2007
(115)
- ► dezembro 2007 (13)
- ► novembro 2007 (16)
- ► outubro 2007 (19)
- ► setembro 2007 (8)
- ► agosto 2007 (8)
- ► julho 2007 (18)
- ► junho 2007 (12)
- ► fevereiro 2007 (4)
-
►
2006
(13)
- ► novembro 2006 (13)
HISTÓRIA
EDUCAÇÃO
OUTRAS REVISTAS
SITES PARA PESQUISA
SITES DE HISTÓRIA
SITES DE EDUCAÇÃO
SITES DE EDUCAÇÃO INCLUSIVA
SITES DE MUSEUS
SITES DE BIBLIOTECAS VIRTUAIS EDUCAÇÃO, HISTÓRIA, LITERATURA
SITES DE LIVROS GRÁTIS
BUSCADORES
DIVERÇÃO
CONTEÚDO DO BLOG
ESTE BLOG DISPONIBILIZA GRATUITAMENTE VÁRIOS CONTEÚDOS RELACIONADOS COM EDUCAÇÃO E HISTORIA. TODOS OS LINKS E ASSUNTOS AQUI APRESENTADOS SÃO ENCONTRADOS LIVREMENTE NA INTERNET. TODOS OS LINKS AQUI DISPONIBILIZADOS SÃO TESTADOS E PODEMOS AFIRMAR COM TODA CERTEZA QUE SÃO LIVRES DE VÍRUS OU QUALQUER OUTRO MALWARE. OS ASSUNTOS AQUI ABORDADOS SÃO:
EDUCAÇÃO, HISTORIA, PEDAGOGIA, EDUCAÇÃO INCLUSIVA, MUSEUS, BIBLIOTECAS VIRTUAIS, E-BOOKS GRATUITOS, SITES PARA PESQUISA NA ÁREA EDUCACIONAL E DE HISTORIA. PRÉ-HISTÓRIA - CRIACIONISMO - EVOLUCIONISMO - A EVOLUÇÃO DO HOMEM - PERÍODO PALEOLÍTICO - IDADE MODERNA - FORTALEZAS INCAS - MUNDO ÁRABE - GUERRA FRIA - GUERRA DOS SEIS DIAS - GUERRA DA BÓSNIA - HISTÓRIA GERAL - BRASIL COLÔNIA - A ORIGEM DO TERMO "BRASIL" - AS GRANDES NAVEGAÇÕES - DESCOBRIMENTO DO BRASIL - PERÍODO PRÉ-COLONIAL - ECONOMIA AÇUCAREIRA - PERÍODO NEOLÍTICO - IDADE DOS METAIS - CULTURA NOK - IDADE ANTIGA - MARAVILHAS DO MUNDO ANTIGO - EGITO ANTIGO - FARAÓ - SUMÉRIOS E ACÁDIOS – BABILÔNIOS - OS PERSAS - GOVERNO LULA - COLONIZAÇÃO ESPANHOLA - ADMINISTRAÇÃO COLONIAL ESPANHOLA - MESOPOTÂMIA - FENÍCIOS - HEBREUS - HEBREUS: DOS PATRIARCAS AOS JUÍZES - HEBREUS: MONARQUIA, DIÁSPORA E REUNIFICAÇÃO - IMPÉRIO BIZANTINO - IMPÉRIO OTOMANO - ALEXANDRE MAGNO - REFORMA PROTESTANTE - REFORMA LUTERANA - CALVINISMO - ANGLICANISMO - CONTRA-REFORMA - MONARQUIAS NACIONAIS - MERCANTILISMO - RENASCIMENTO - A FORMAÇÃO DOS ESTADOS IBÉRICOS - A EXPANSÃO MARÍTIMA PORTUGUESA - BULA INTER COETERA E TRATADO DE TORDESILHAS - REVOLUÇÃO INGLESA - REVOLUÇÃO INDUSTRIAL - ILUMINISMO - LIBERALISMO - INDEPENDÊNCIA DOS ESTADOS UNIDOS - CAPITALISMO - ABOLIÇÃO DA ESCRAVATURA - REVOLUÇÃO FRANCESA - IDADE CONTEMPORÂNEA - REVOLUÇÃO INDUSTRIAL - O DESENVOLVIMENTO DAS MAQUINOFATURAS - GUERRA DOS FARRAPOS - BALAIADA - CABANAGEM - SEGUNDO REINADO - ECONOMIA CAFEEIRA - REVOLUÇÃO PRAIEIRA - GUERRA DO PARAGUAI - BRASIL REPÚBLICA - PROCLAMAÇÃO DA REPÚBLICA - GOVERNO DEODORO DA FONSECA - GOVERNO HERMES DA FONSECA - FORMAÇÃO DA CLASSE OPERÁRIA - PRIMEIRA GUERRA MUNDIAL - ERA NAPOLEÔNICA - CONGRESSO DE VIENA - ARTE, CIÊNCIA E LITERATURA NO SÉCULO XIX - COMUNA DE PARIS - GUERRA DE SECESSÃO - ANARQUISMO - REVOLUÇÃO RUSSA - CRISE DE 1929 - GUERRA CIVIL ESPANHOLA - NEOLIBERALISMO - GUERRA DA CORÉIA - CRISE RUSSA - FARC - A RENÚNCIA DE FIDEL CASTRO - QUESTÃO TIBETANA - GUERRAS PELO MUNDO - GUERRA DO PELOPONESO - SEGUNDA GUERRA MUNDIAL - GRÉCIA: CIVILIZAÇÃO GREGA - AS ORIGENS DE ROMA - MONARQUIA - REPÚBLICA REVOLTAS PLEBÉIAS - GUERRAS PÚNICAS, IMPÉRIO ROMANO - CRISTIANISMO PRIMITIVO - A CRISE DO IMPÉRIO ROMANO - IDADE MÉDIA - CRISE DO IMPÉRIO ROMANO - POVOS GERMÂNICOS - INVASÕES BÁRBARAS - AS INFLUÊNCIAS GERMÂNICAS E ROMANAS NO OCIDENTE MEDIEVAL - REINO DOS FRANCOS – FEUDALISMO - A IGREJA NA IDADE MÉDIA - A IGREJA E AS CRUZADAS - QUERELA DAS INVESTIDURAS - GUERRA DOS CEM ANOS - CRUZADAS - HERESIAS MEDIEVAIS - REVOLTAS CAMPONESAS - CRISE DO FEUDALISMO - ESCRAVIDÃO NO BRASIL - DROGAS DO SERTÃO - CAPITANIAS HEREDITÁRIAS - GOVERNOS GERAIS - OS POVOS INDÍGENAS NO BRASIL - JESUÍTAS - O NEGRO - AS PRIMEIRAS CIDADES - A UNIÃO IBÉRICA - AS INVASÕES HOLANDESAS - INSURREIÇÃO PERNAMBUCANA - AS INVASÕES FRANCESAS - ATIVIDADES COMPLEMENTARES DAS ECONOMIA COLONIAL - ECONOMIA MINERADORA - REFORMAS POMBALINAS - RENASCIMENTO AGRÍCOLA - 11 DE SETEMBRO - ACIDENTE NUCLEAR EM CHERNOBYL - FIM DA URSS - FASCISMO - TOTALITARISMO - NAZISMO - ERWIN ROMMEL - MARTIN LUTHER KING - REVOLTAS COLONIAIS - ACLAMAÇÃO DE AMADOR BUENO - A GUERRA DOS EMBOABAS - MOTINS DO MANETA - A GUERRA DOS MASCATES - A REVOLTA DE FILIPE DOS SANTOS - INCONFIDÊNCIA MINEIRA - REVOLUÇÃO PERNAMBUCANA - BRASIL IMPÉRIO - A CONJURAÇÃO BAIANA - INDEPENDÊNCIA DO BRASIL - PRIMEIRO REINADO - ASSEMBLÉIA CONSTITUINTE - CONFEDERAÇÃO DO EQUADOR - GUERRA DA CISPLATINA - FIM DO PRIMEIRO REINADO - NOITE DAS GARRAFADAS - GUERRA DE CANUDOS - TENENTISMO - REVOLUÇÃO DE 1930 - O BRASIL NA SEGUNDA GUERRA MUNDIAL - LIBERALISMO - NACIONALISMO - GOVERNO DUTRA - JK - FIDEL CASTRO - GOVERNOS MILITARES - GRÉCIA ANTIGA - PERÍODO PRÉ-HOMÉRICO - PERÍODO HOMÉRICO - ESPARTA E ATENAS - PERÍODO HELENÍSTICO - DEUSES GREGOS - ROMA: CIVILIZAÇÃO ROMANA - FATORES DO GOLPE MILITAR - O ESTOPIM DO GOLPE MILITAR - AS BASES DO ESTADO AUTORITÁRIO - GOVERNO COSTA E SILVA - MARECHAL CASTELLO BRANCO - GOVERNO MÉDICI - GOVERNO FIGUEIREDO - BRASIL ATUAL - A IDENTIDADE DA NAÇÃO BRASILEIRA - DIRETAS JÁ! - A CONSTITUIÇÃO DE 1988 - GOVERNO JOSÉ SARNEY - GOVERNO COLLOR DE MELLO - GOVERNO DE ITAMAR FRANCO - PLANO REAL - REBELIÃO TÚPAC AMARU (1780) -MOVIMENTO COMUNERO (1781) - REVOLUÇÃO HAITIANA - INDEPENDÊNCIA DA AMÉRICA ESPANHOLA - EXÉRCITO ZAPATISTA DE LIBERTAÇÃO NACIONAL - PERONISMO - DITADURA CHILENA
EDUCAÇÃO, HISTORIA, PEDAGOGIA, EDUCAÇÃO INCLUSIVA, MUSEUS, BIBLIOTECAS VIRTUAIS, E-BOOKS GRATUITOS, SITES PARA PESQUISA NA ÁREA EDUCACIONAL E DE HISTORIA. PRÉ-HISTÓRIA - CRIACIONISMO - EVOLUCIONISMO - A EVOLUÇÃO DO HOMEM - PERÍODO PALEOLÍTICO - IDADE MODERNA - FORTALEZAS INCAS - MUNDO ÁRABE - GUERRA FRIA - GUERRA DOS SEIS DIAS - GUERRA DA BÓSNIA - HISTÓRIA GERAL - BRASIL COLÔNIA - A ORIGEM DO TERMO "BRASIL" - AS GRANDES NAVEGAÇÕES - DESCOBRIMENTO DO BRASIL - PERÍODO PRÉ-COLONIAL - ECONOMIA AÇUCAREIRA - PERÍODO NEOLÍTICO - IDADE DOS METAIS - CULTURA NOK - IDADE ANTIGA - MARAVILHAS DO MUNDO ANTIGO - EGITO ANTIGO - FARAÓ - SUMÉRIOS E ACÁDIOS – BABILÔNIOS - OS PERSAS - GOVERNO LULA - COLONIZAÇÃO ESPANHOLA - ADMINISTRAÇÃO COLONIAL ESPANHOLA - MESOPOTÂMIA - FENÍCIOS - HEBREUS - HEBREUS: DOS PATRIARCAS AOS JUÍZES - HEBREUS: MONARQUIA, DIÁSPORA E REUNIFICAÇÃO - IMPÉRIO BIZANTINO - IMPÉRIO OTOMANO - ALEXANDRE MAGNO - REFORMA PROTESTANTE - REFORMA LUTERANA - CALVINISMO - ANGLICANISMO - CONTRA-REFORMA - MONARQUIAS NACIONAIS - MERCANTILISMO - RENASCIMENTO - A FORMAÇÃO DOS ESTADOS IBÉRICOS - A EXPANSÃO MARÍTIMA PORTUGUESA - BULA INTER COETERA E TRATADO DE TORDESILHAS - REVOLUÇÃO INGLESA - REVOLUÇÃO INDUSTRIAL - ILUMINISMO - LIBERALISMO - INDEPENDÊNCIA DOS ESTADOS UNIDOS - CAPITALISMO - ABOLIÇÃO DA ESCRAVATURA - REVOLUÇÃO FRANCESA - IDADE CONTEMPORÂNEA - REVOLUÇÃO INDUSTRIAL - O DESENVOLVIMENTO DAS MAQUINOFATURAS - GUERRA DOS FARRAPOS - BALAIADA - CABANAGEM - SEGUNDO REINADO - ECONOMIA CAFEEIRA - REVOLUÇÃO PRAIEIRA - GUERRA DO PARAGUAI - BRASIL REPÚBLICA - PROCLAMAÇÃO DA REPÚBLICA - GOVERNO DEODORO DA FONSECA - GOVERNO HERMES DA FONSECA - FORMAÇÃO DA CLASSE OPERÁRIA - PRIMEIRA GUERRA MUNDIAL - ERA NAPOLEÔNICA - CONGRESSO DE VIENA - ARTE, CIÊNCIA E LITERATURA NO SÉCULO XIX - COMUNA DE PARIS - GUERRA DE SECESSÃO - ANARQUISMO - REVOLUÇÃO RUSSA - CRISE DE 1929 - GUERRA CIVIL ESPANHOLA - NEOLIBERALISMO - GUERRA DA CORÉIA - CRISE RUSSA - FARC - A RENÚNCIA DE FIDEL CASTRO - QUESTÃO TIBETANA - GUERRAS PELO MUNDO - GUERRA DO PELOPONESO - SEGUNDA GUERRA MUNDIAL - GRÉCIA: CIVILIZAÇÃO GREGA - AS ORIGENS DE ROMA - MONARQUIA - REPÚBLICA REVOLTAS PLEBÉIAS - GUERRAS PÚNICAS, IMPÉRIO ROMANO - CRISTIANISMO PRIMITIVO - A CRISE DO IMPÉRIO ROMANO - IDADE MÉDIA - CRISE DO IMPÉRIO ROMANO - POVOS GERMÂNICOS - INVASÕES BÁRBARAS - AS INFLUÊNCIAS GERMÂNICAS E ROMANAS NO OCIDENTE MEDIEVAL - REINO DOS FRANCOS – FEUDALISMO - A IGREJA NA IDADE MÉDIA - A IGREJA E AS CRUZADAS - QUERELA DAS INVESTIDURAS - GUERRA DOS CEM ANOS - CRUZADAS - HERESIAS MEDIEVAIS - REVOLTAS CAMPONESAS - CRISE DO FEUDALISMO - ESCRAVIDÃO NO BRASIL - DROGAS DO SERTÃO - CAPITANIAS HEREDITÁRIAS - GOVERNOS GERAIS - OS POVOS INDÍGENAS NO BRASIL - JESUÍTAS - O NEGRO - AS PRIMEIRAS CIDADES - A UNIÃO IBÉRICA - AS INVASÕES HOLANDESAS - INSURREIÇÃO PERNAMBUCANA - AS INVASÕES FRANCESAS - ATIVIDADES COMPLEMENTARES DAS ECONOMIA COLONIAL - ECONOMIA MINERADORA - REFORMAS POMBALINAS - RENASCIMENTO AGRÍCOLA - 11 DE SETEMBRO - ACIDENTE NUCLEAR EM CHERNOBYL - FIM DA URSS - FASCISMO - TOTALITARISMO - NAZISMO - ERWIN ROMMEL - MARTIN LUTHER KING - REVOLTAS COLONIAIS - ACLAMAÇÃO DE AMADOR BUENO - A GUERRA DOS EMBOABAS - MOTINS DO MANETA - A GUERRA DOS MASCATES - A REVOLTA DE FILIPE DOS SANTOS - INCONFIDÊNCIA MINEIRA - REVOLUÇÃO PERNAMBUCANA - BRASIL IMPÉRIO - A CONJURAÇÃO BAIANA - INDEPENDÊNCIA DO BRASIL - PRIMEIRO REINADO - ASSEMBLÉIA CONSTITUINTE - CONFEDERAÇÃO DO EQUADOR - GUERRA DA CISPLATINA - FIM DO PRIMEIRO REINADO - NOITE DAS GARRAFADAS - GUERRA DE CANUDOS - TENENTISMO - REVOLUÇÃO DE 1930 - O BRASIL NA SEGUNDA GUERRA MUNDIAL - LIBERALISMO - NACIONALISMO - GOVERNO DUTRA - JK - FIDEL CASTRO - GOVERNOS MILITARES - GRÉCIA ANTIGA - PERÍODO PRÉ-HOMÉRICO - PERÍODO HOMÉRICO - ESPARTA E ATENAS - PERÍODO HELENÍSTICO - DEUSES GREGOS - ROMA: CIVILIZAÇÃO ROMANA - FATORES DO GOLPE MILITAR - O ESTOPIM DO GOLPE MILITAR - AS BASES DO ESTADO AUTORITÁRIO - GOVERNO COSTA E SILVA - MARECHAL CASTELLO BRANCO - GOVERNO MÉDICI - GOVERNO FIGUEIREDO - BRASIL ATUAL - A IDENTIDADE DA NAÇÃO BRASILEIRA - DIRETAS JÁ! - A CONSTITUIÇÃO DE 1988 - GOVERNO JOSÉ SARNEY - GOVERNO COLLOR DE MELLO - GOVERNO DE ITAMAR FRANCO - PLANO REAL - REBELIÃO TÚPAC AMARU (1780) -MOVIMENTO COMUNERO (1781) - REVOLUÇÃO HAITIANA - INDEPENDÊNCIA DA AMÉRICA ESPANHOLA - EXÉRCITO ZAPATISTA DE LIBERTAÇÃO NACIONAL - PERONISMO - DITADURA CHILENA
ESTE BLOG É PARA TURMA HID 0141 LICENCIATURA EM HISTORIA UNIASSELVI FLORIANÓPOLIS, MAS PODE E DEVE SER USADO POR QUALQUER PESSOA INTERESSADA NOS ASSUNTOS AQUI DISPONIBILIZADOS.
AGRADECEMOS A VISITA VOLTE SEMPRE E DIVULGUE NOSSA IDEIA
AGRADECEMOS A VISITA VOLTE SEMPRE E DIVULGUE NOSSA IDEIA